What is the McCree Curve ?
- Home
- What is the McCree Curve ?
What is the McCree Curve ?

Please Note – Also, these experiments were conducted using small leaf samples of 22 food crop plant species and therefore do not reflect the response of a whole plant or of all plant species. Finally the curve represents photons that have been absorbed, not photons emitted from a light source.
References:
http://biology.mcgill.ca/Phytotron/LightWkshp1994/1.5%20Bugbee/Bugbee%20text.html
https://hortione.com/2018/10/23/mccree-photosynthesis-action-curve/
https://www.sciencedirect.com/science/article/abs/pii/0002157171900227
What Is the McCree Curve?
The McCree Curve is a fundamental concept in the field of plant biology, horticulture, and photobiology. Named after the American plant physiologist William A. McCree, this curve is a graphical representation of the relative efficiency of different wavelengths of light in driving photosynthesis and influencing plant growth. Understanding the McCree Curve is crucial for tailoring artificial lighting in indoor gardening and greenhouse cultivation to optimize plant development.
The Basics of the McCree Curve
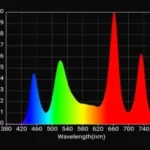
The McCree Curve is a graph that illustrates the relationship between different regions of the light spectrum and their effectiveness in promoting photosynthesis. This curve typically covers the wavelength range from 400 to 700 nanometers, which corresponds to the visible light spectrum. The McCree Curve provides insights into how efficiently plants use different colors of light, with a focus on blue (400-500 nm), red (600-700 nm), and green (500-600 nm) light.
The Peaks and Valleys of Efficiency
The McCree Curve demonstrates distinct peaks and valleys in photosynthetic efficiency across the visible light spectrum:
1. Blue Light (around 440-460 nm): The curve reveals a significant peak in photosynthetic efficiency in the blue region of the spectrum. This suggests that plants are highly efficient at using blue light for photosynthesis, particularly during the absorption of energy by chlorophylls.
2. Red Light (around 640-680 nm): Another peak is observed in the red region of the spectrum. Red light is essential for chlorophyll absorption during the photosynthesis process. It plays a vital role in the formation of energy-rich compounds, such as adenosine triphosphate (ATP).
3. Green Light (around 510-570 nm): Surprisingly, the McCree Curve shows that plants are less efficient at using green light. This region of the spectrum is where the curve dips, signifying lower photosynthetic efficiency. While green light is not wasted, plants primarily reflect it, which is why they appear green to our eyes.
Practical Implications for Indoor Gardening and Greenhouse Cultivation
Understanding the McCree Curve is essential for growers because it informs lighting decisions in controlled environments. Here’s how it can be applied:
– Lighting Design: Growers use the McCree Curve to design lighting systems that emit the optimal balance of blue and red light for photosynthesis. This balance promotes robust plant growth, from seedlings to flowering.
– Growth Stages: By adjusting the light spectrum according to growth stages, growers can maximize efficiency. For example, more blue light is beneficial during vegetative growth, while red light is crucial during flowering.
– Energy Efficiency: Knowledge of the McCree Curve enables growers to use energy more efficiently, reducing the energy costs associated with artificial lighting.
– Crop Selection: The McCree Curve aids in crop selection, helping growers choose species that respond well to the light spectrum their lighting system provides.
In Conclusion
The McCree Curve is an indispensable tool for growers aiming to optimize plant growth in indoor gardening and greenhouse settings. By applying the insights gained from this curve, growers can design efficient lighting systems that provide the right light spectrum at the right growth stage, resulting in healthier, more productive plants.
- Blog Categories
- Basic of Artificial Lighting for Plants
- Basic of grow Light
- Case Studies
- General Awareness
- Indoor Vertical Farming
- Medical Plant Research
- Online Tool
- Pitch Grow Light
- Plant Lighting Measurement
- Speed Breeding
- Supplemental Lighting
- Tissue Culture Grow Lights
- Indoor gardening
- LED Grow Lights
- Pharma Segment
- General
Shop Products
2Ft 9W Grow Light for Leafy Vegetables
₹317.00 – ₹546.00Price range: ₹317.00 through ₹546.00
4Ft 18W Grow Light for Saffron
₹465.00 – ₹810.00Price range: ₹465.00 through ₹810.00
Popular Products
Enquire Now
Quick Link
Other Links
Design & Developed By VBTEK













Leave A Comment